Research Shallow water modal evolution due to internal waves
Abstract
Acoustic modal behavior is reported for an L-shape hydrophone array during the passage of a strong nonlinear internal wave packet. The acoustic track is nearly parallel to the front of nonlinear internal waves. Through modal decomposition at the vertical array, acoustic modes are identified. Modal evolution along the horizontal array then is examined during a passing internal wave. Strong intensity fluctuations of individual modes are observed before and during the internal waves, the packet passes the fixed acoustic track showing a detailed evolution of the waveguide modal behavior. Acoustic refraction created either uneven distribution of modal energy over the horizontal array or additional returns observable at the entire L-shape array. Acoustic ray-mode simulations are used to phenomenologically explain the observed modal behavior.
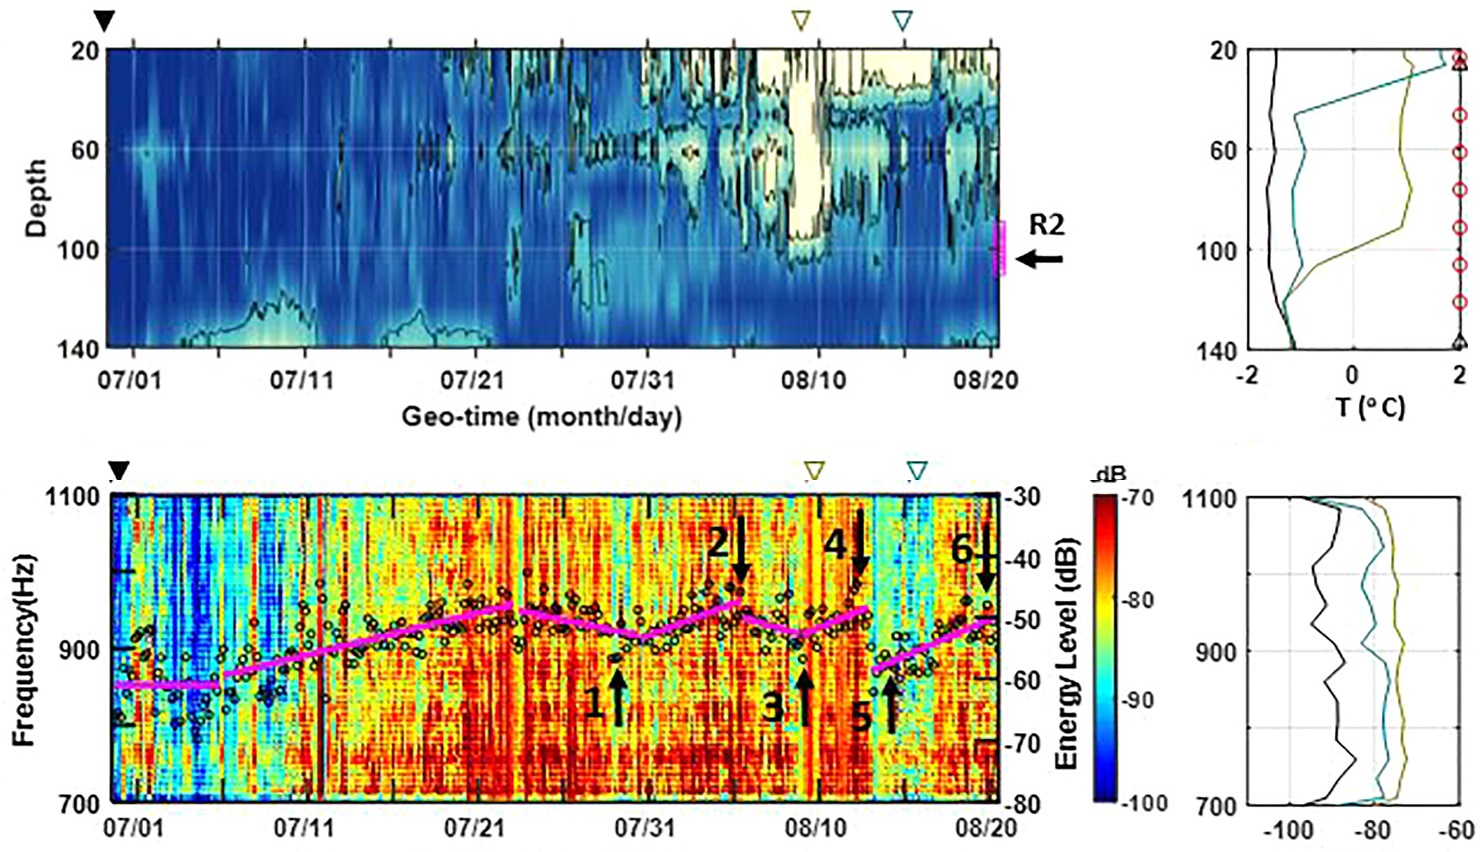
As shown in Fig. 1, the temperature profile exhibits spatial and temporal variability due to the presence of internal waves. A Barycentric interpolation method was utilized to obtain the point within each triangle. The resulting NLIW fronts at these three patches of ocean (i.e. close to source, middle-way, and receiver positions) were smoothly connected by the fourth order polynomial fitting, yielding the reconstructed IW events shown below.
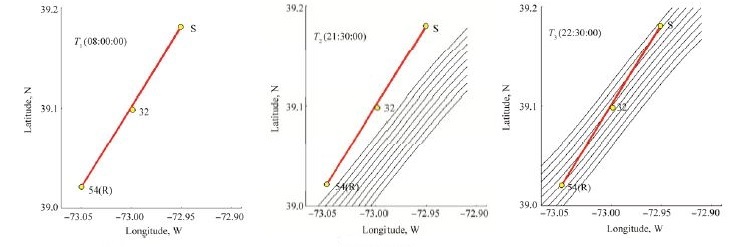
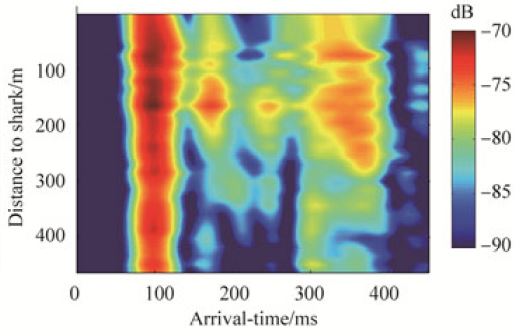
Fig. 2 shows the evolution of acoustic modal behavior, when the packet of strong internal waves passed through the acoustic track. (a) shows the modal decomposition results for three geo-times $T_1$−$T_3$, respectively. The first three modes were identified using the reduced rank pseudo-inverse mode filter. It is noted that the value of the modal amplitude is relative. (b) and (c) show the impulse responses at the vertical and horizontal line arrays, respectively, obtained by pulse compression of the received m-sequences. Especially, (b) shows the impulse responses at the vertical line array, with the shallowest element shown at the top. (c) shows the impulse responses at the horizontal array, with the furthest element away the vertical line array shown at the bottom. The color indicates the intensity, with the same scale for all the plots.
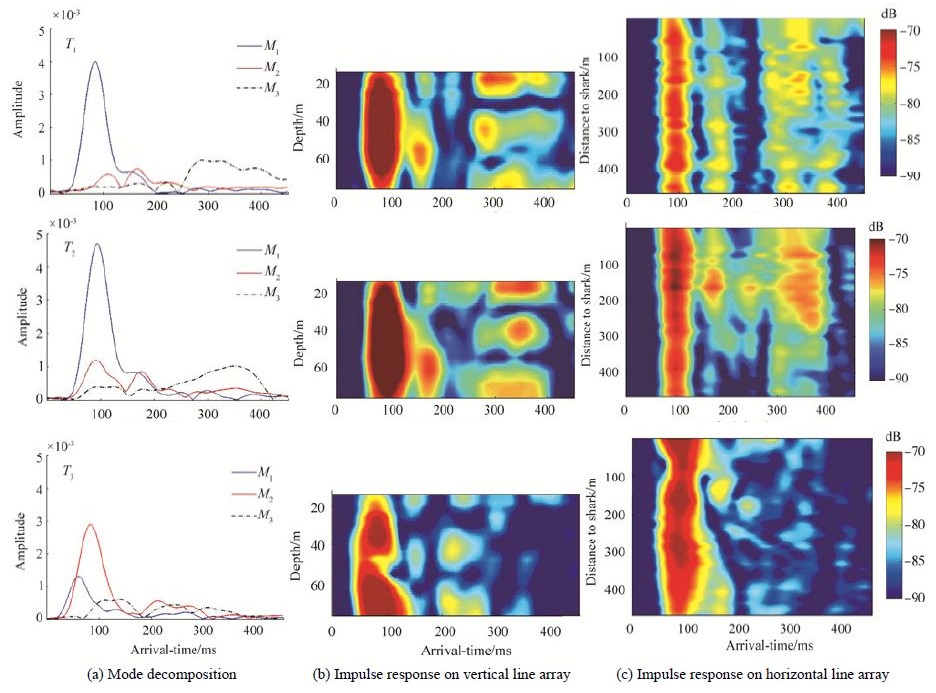
The evolution of acoustic normal modes along the HLA was observed before, onset, and within the presence of internal wave during a NLIW event in SW06 experiment. The impulse response of 100 Hz M-sequences signals received at a distance of about 20 km is analyzed to study the internal wave effects on the first three normal modes. The modal behavior is summarized. 1) the first mode arrival is stable throughout the internal wave event. 2) the uneven distribution of modal intensity over the HLA is observed. These experimental observation is explained by the acoustic ray mode simulation. 3) the arrival time difference between the first and the higher order modes becomes smaller in the presence of internal waves.
Related publications
-
Georges A. Dossot, Kevin B. Smith, Mohsen Badiey, James H. Miller, and Gopu R. Potty. DOI: 10.1121/1.5125260. [PDF]
-
Shallow water modal evolution due to nonlinear internal waves
Mohsen Badiey, Lin Wan & Jing Luo. DOI: 10.1007/s11804-017-1415-9. [PDF]