Motivation: Video rendering on the Oculus Quest vs. Edge server
Oculus Quest has an integrated GPU module for stand-alone rendering of the scenes without needing an edge server. However, due to heavy computation requirements of 3D games, the energy consumption of head mounted display (HMD) is high. Also, including an advanced GPU in an HMD increases the production cost which might force the user to change the HMD (in the future) if the GPU capability is not enough for higher resolution contents. Instead, offloading the rendering to the edge servers, not only reduces the production cost and the energy consumption of the HMD but also allows for independent innovation of the GPU technology from the HMD technology of course at the cost of heavier wireless traffic. In the video below, we compared the performance of stand-alone rendering (Oculus Quest) vs. edge rendering with "Rec Room", a game with low graphics requirements. It can be seen that the initial game window is loaded faster with stand-alone rendering but there is a significant delay to load the game. Although game quality is acceptable in both renderings, Oculus Quest has a lag in loading some of the scenes. Therefore, in this research, we intend to characterize the VR traffic over an edge-enabled Wi-Fi network.
VR traffic collection over Wi-Fi
Topology and setup
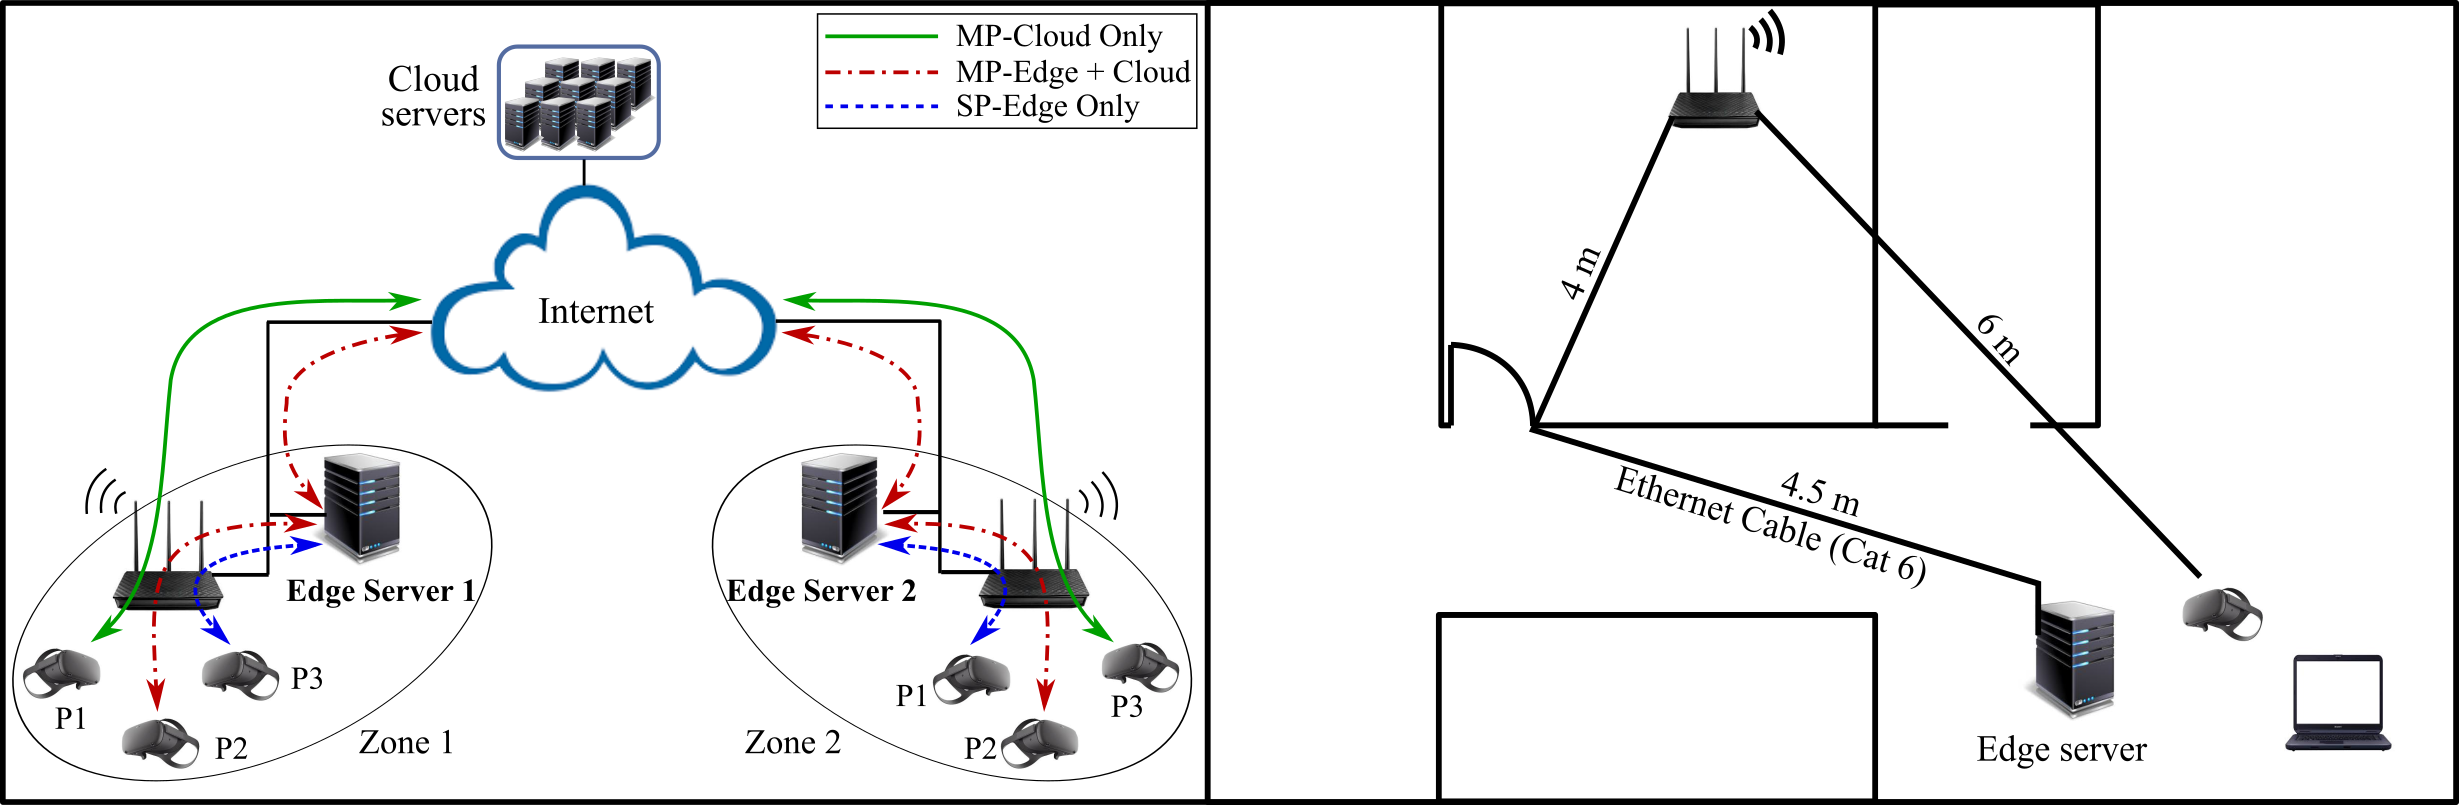
The Figure above illustrates an schematic diagram of an End-To-End edge-enabled network and the topology of the network over which we collected different VR applications' traffic. We can categorize VR applications into single party (SP) and multi party (MP). MP VR applications require communication with each other which can happen through a cloud server. Rendering can take place either on the VR HMD or at the edge server. In our experiment, the VR HMD and the AP are connected through a 20 MHz bandwidth (channel 161). The wireless router is an ASUS TM-AC1900 and the HMD is an Oculus Quest. Air Light VR (ALVR) software is used to be able to render HMD video traffic on the server.
Traffic Collection
To be able to compute the network statistics (by postprocessing the packets), we need to capture traffic from both the wireless link and the wired one. For the wired link, we can capture the Ethernet traffic between the wireless router and the edge server with Wireshark. However, for the wireless network, we need another computer to sniff the traffic between the HMD and the wireless router. Therefore, we placed a laptop close to the HMD to capture the wireless traffic. Also, we recorded the scenes in playing one game, "Rec Room", and icluded them in the video of captured traffic. The video below is a 4in1 video of packet capture of Wi-Fi (left) and Ethernet (right) and scenes recorded on the HMD (left) and on the server (right).
Download traffic collection
Our experiment is open sourced. You can download it by clicking the button below. It is important to note that the Wireshark pcap files are large and therefore, the zip file is large (~ 2.5 GB). Once you unzip the file, you can access the Ethernet and Wi-Fi traffic collection. Also the traffic collection at the application layer is included in each folder; HMD_log.txt is the statistics of the ALVR client and vrserver.txt is the statistics of the ALVR server. There is also a Matlab script (A0_server_client.m) which uses these application layer statistics to plot the results. If you have any questions please contact salehi@udel.edu.