- Run your program and generate the data you want to graph
in a row/column format, with tabs between
each of the items in a given row.
Do this by modifying the print statements or
cutting-and-pasting the data. For example:
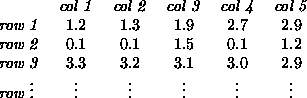
printf("%f\t%f\t%f\t%f\t%f\n", data[0],data[1],data[2],data[3],data[4]);Produces output formatted like:
- Save this data as a text file.
- Sit down at a PC in one of the University computing labs (ie. Smith Hall lab).
- FTP your data. Double-click on
the
ftpicon, then click New, and type the name of the machine on which your data file resides (ie.porsche.cis.udel.edu). Enter your login name and password, then click OK. Find your data file, and Copy it to the local PC hard drive or a floppy disk.
- Start Microsoft Word (double-click).
- Select File, Open on the pull-down menu.
- Locate your data file, which may take a bit of navigation to the correct directory or floppy. Select the data file and click OK. The data file will now be in the Microsoft Word document.
- Highlight the entire block of data using the mouse.
- Select Table, Convert text to table. Follow on-screen prompts. The data will now be converted into Microsoft Word table format.
- Select the table by clicking in it, then selecting Table, Select Table from the pull-down menus.
- Next, select Insert, Object.
- From the scolling list, select Microsoft Graph 5.0, and click OK.
- Follow the prompts that will guide you through the steps it takes to create the graph. There are many configurations, so some experimentation may be necessary to get the format that shows your data as clearly as possible.
- When done, you will have a graph of your data! Once this graph is created, it can be modified in Microsoft Word and displayed in any of a large number of black-and-white, color, and two- and three-dimensional formats.
- Save the document containing your graph. You can save
it to a floppy, or temporarily to the hard drive and then
ftpit back to your account. - Print your graph when done if you like, or incorporate it directly into a write-up (which you can also do in Microsoft Word).
- Delete any stray files (data, etc.) you may have created on the local hard drive.