When the project is due, turn in hard copies of the rules defining the program, three hand-drawn or computer-drawn state diagrams, the deffacts defining those three nontrivial state diagrams, and the three finite state automaton descriptions generated by your program. Graduate students will turn in an additional three diagrams and outputs as described below.
Undergraduate students will do the above for nondeterministic finite state automata, including the possibility of epsilon transitions. Graduate students will do the above for deterministic finite state automata, their programs will also detect when the state diagram does not represent a deterministic finite state automaton. They should also include three more examples of deffacts and the corresponding outputs that demonstrate that their program can detect when a transition is missing, when there is more than one transition from a state for the same input letter, and when there is an epsilon transition in the diagram.
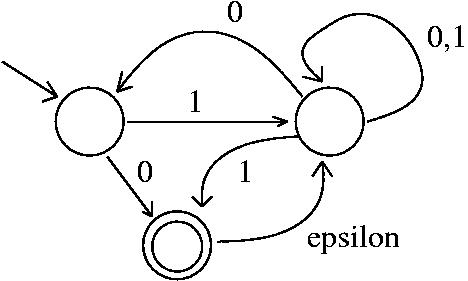
(curve id x1 y1 x2 y2) --- id is an identifier unique to each curve (body of an arc); one end of the curve has coordinates x1,y1 and the other end has coordinates x2,y2.
(line x1 y1 x2 y2) --- a short straight line comprising one side of the arrow at one end of a curve. Either end of the line could be near the end point of the curve with which it combines to make an arc.
(label id fsa-letter) --- curve with identifier id has fsa-letter next to it, indicating an input letter that can cause a transition across that curve.
(circle radius x y) --- a circle with the specified radius and centered at x,y. There will be two sizes of circles. There will be one circle of the larger size for each state of the FSA. There will be one circle of the smaller size for each accepting state of the FSA. NOTE: Do not assume fixed sizes for these circles. The sizes can change from diagram to diagram; only assume that there will be two sizes per diagram.
You can estimate the coordinates by eye by looking at the state diagram. Your estimates don't have to be very accurate, since points that are supposed to be different are well separated, as are the states, so it is clear to which state an end-point is nearest.
Here is the deffacts for the above state diagram:
(deffacts diagram1 " nondeterministic fsa with three states"
(circle 1 9 10)
(circle 1 18 10)
(circle 1 12 15)
(circle 0.7 12 15)
(curve a 5.5 8 8.1 9.1)
(line 8.1 9.1 7.8 8.8)
(line 7.7 9.3 8.1 9.1)
(curve b 9.9 9.9 17.1 9.3)
(line 10 9.2 9.9 9.9)
(line 11 9.8 9.89 9.89)
(label b 0)
(curve c 10 10 17 10)
(label c 1)
(line 16.6 9.8 17 10)
(line 16.6 10.2 17 10)
(curve d 19 10 18 9)
(label d 0)
(label d 1)
(line 17.6 8.9 18 9)
(line 18 9 18.1 8.6)
(curve e 9.8 10.8 11.3 14.3)
(label e 0)
(line 11.1 14.2 11.3 14.3)
(line 11.3 14.1 11.3 14.3)
(curve f 12.7 14.3 17.2 10.8)
(label f 1)
(line 12.5 14 12.7 14.3)
(line 12.7 14.3 13 14)
(curve g 12.8 15.8 18 11)
(label g epsilon)
(line 17.8 11.2 18 11)
(line 18.2 11.2 18 11))
The output description should be neatly formated and should state the following information:
1. The states (a list of numbers)
2. The start state
3. The final or accepting states (a list of numbers)
4. The input alphabet (list of the labels excluding epsilon)
5. The state transitions
The simplest way to display the state transitions, especially while getting the rest of your program to work, would be a list of statements of the form
state fsa-letter -> list-of-next-states
For example, one line of the list of state transistions for the above FSA might be
1 0 -> 0 1
Here is what the output for the above state diagram might look like:
states = 0 1 2
start state = 0
final states = 2
input alphabet = 0 1
state transitions:
0 0 -> 2
0 1 -> 1
1 0 -> 0 1
1 1 -> 1 2
2 epsilon -> 1
You only have to show transistions that are possible according to the state diagram.
You will want to make your program perform as efficiently as possible. Read the "Appendix C: Performance Notes" section of clips.ref for ways to improve program efficiency.
You may want to make your program operate in phases. See the computer facts in ttt.clp and the task facts in life.clp for examples. You might want to simulate backward chaining, the equivalent of calling subroutines. See the goal facts in mab.clp and the backward-chaining example in chap9.man for examples.