Austin J. Brockmeier, John S. Choi, Evan G. Kriminger, Joseph T. Francis, and Jose C. Principe, Neural Computation, Vol. 26, No. 6, pp. 1080-1107, June 2014. DOI:10.1162/NECO_a_00591(author PDF)
When studying the nervous system, the choice of metric for the neural responses is a pivotal assumption. A well-suited distance metric enables neuroscientists to gauge the similarity of neural responses to various stimuli and assess the variability of responses to a repeated stimulus. In particular, neural spike train metrics have been used to quantify the information content carried by the timing of action potentials. While a number of metrics for individual neurons exist, a method to optimally combine single-neuron metrics into multi-neuron, or population-based, metrics is lacking. We pose the problem of optimizing multi-neuron metrics and other metrics for a particular neural decoding task using centered alignment, a kernel-based dependence measure.
Matlab code:
Centered alignment metric learning (CAML)
Batch CAML.m mini-batch case for large datasets with vectors in Euclidean space CAML_approx.m
Batch algorithm requires Mark Schmidt's minFunc toolbox
Test script cmd_simple_test.m
Metric learning for neural encoding models
Replicating the experiments of "Analyzing Neural Responses to Natural Signals: Maximally Informative Dimensions" by Sharpee, Rust, and Bialek, 2004, but replacing the maximally informative direction algorithm with metric-learning.
Data generation
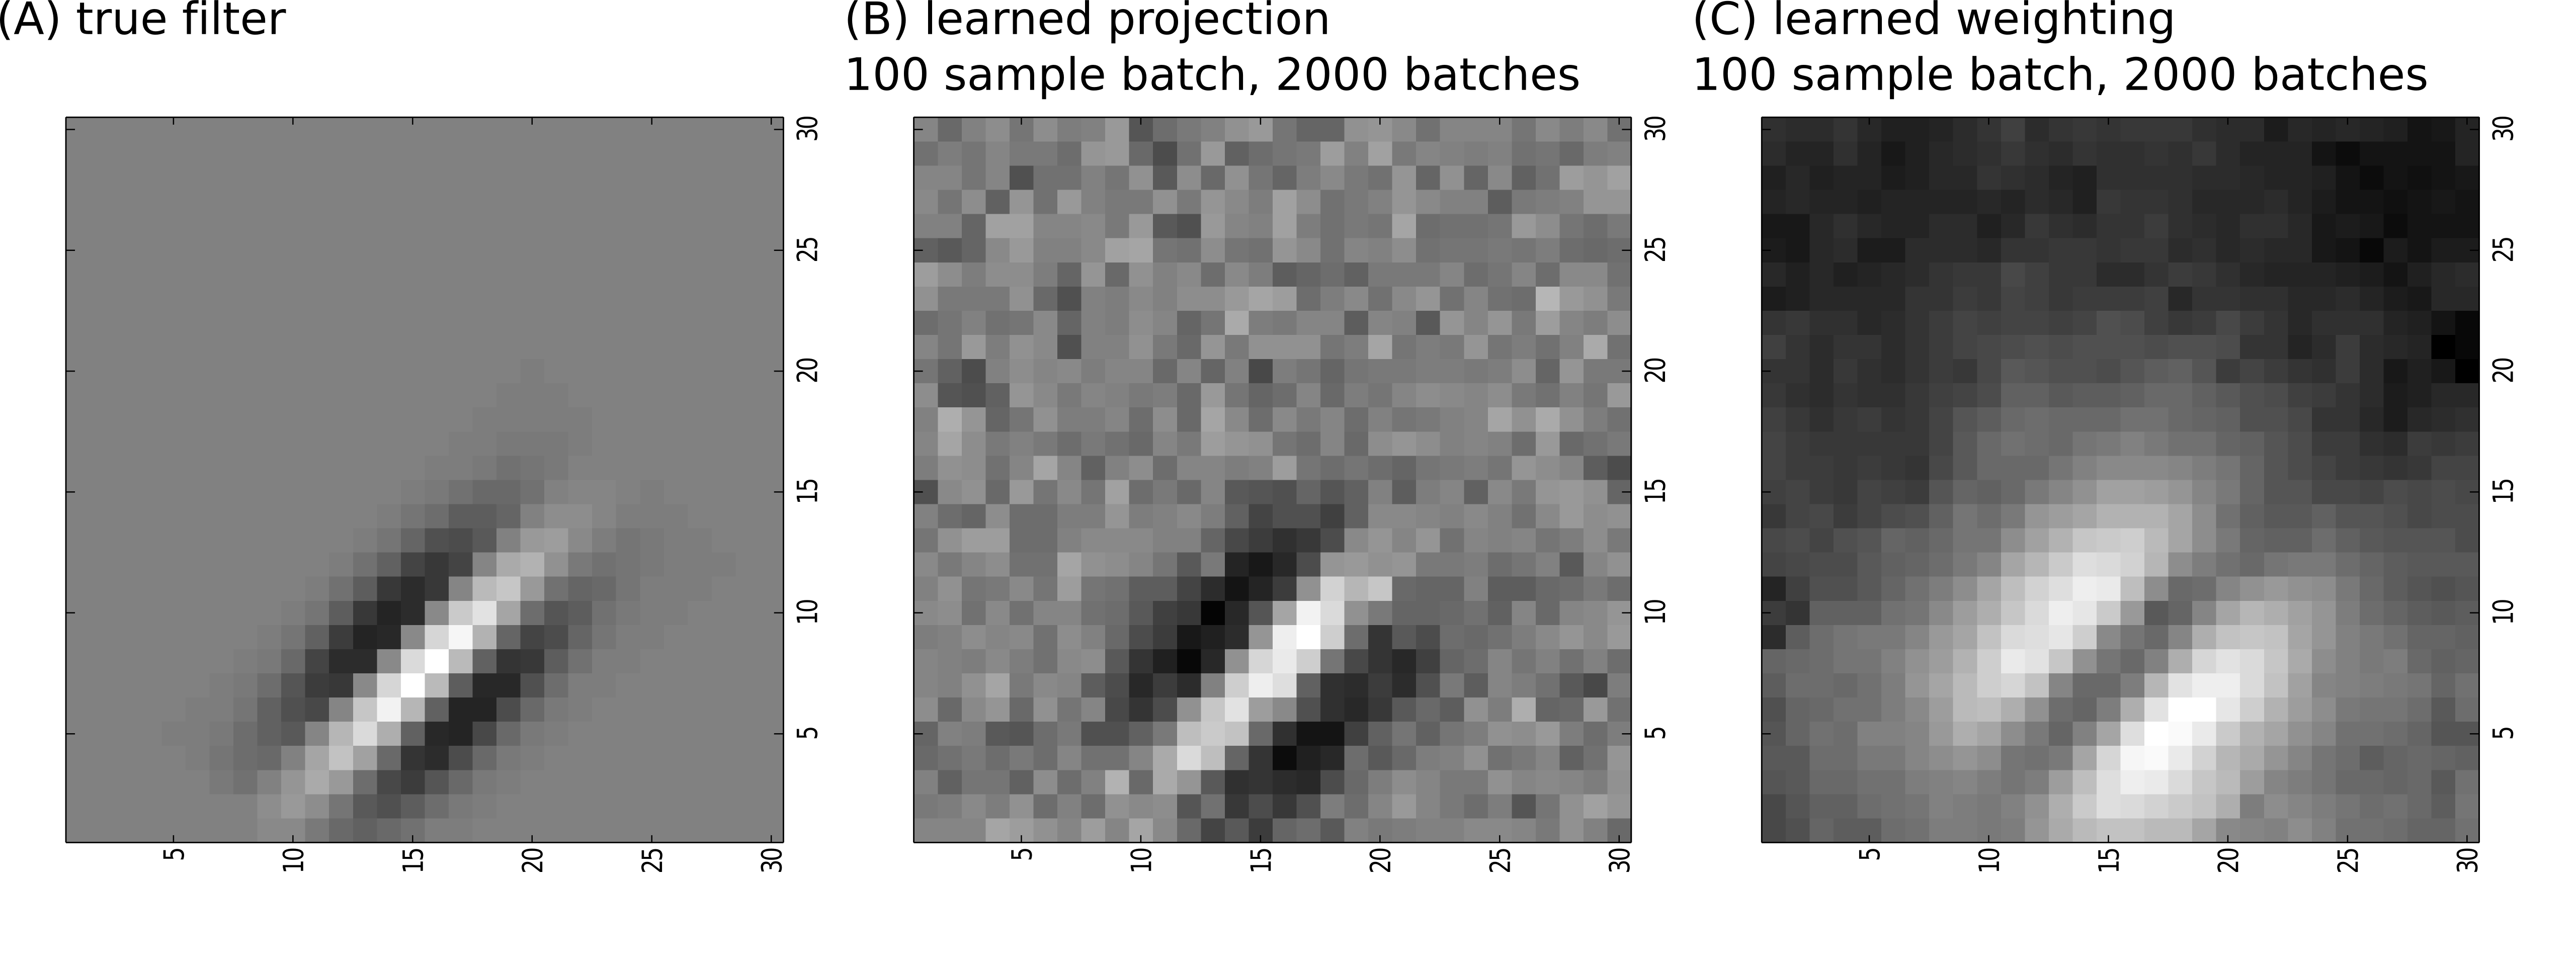
A predefined filter consisting of 3 Gaussian bumps with equal covariance (A) resembled the shape of the filter used by Sharpee et al., but here the Gaussian bumps are offset instead of being centered.
This filter corresponds to the linear weights of a model simple cell, a stochastic neuron. The inner product between an input image and the filter, denoted $s$, is proportional to the probability of the neuron spiking/firing or not. Specifically, a zero-mean Gaussian random variable $e$ with variance $a$ is added to the inner-product, if this sum is greater than the threshold $b$ then a spike is generated.
As input, I use patches from a database of natural images (consisting of buildings, parks, trees, etc.):
Independent Component Filters of Natural Images Compared with Simple Cells in Primary Visual Cortex J. H. v. Hateren and A. v. d. Schaaf Proceedings: Biological Sciences265359-366
(1998)
30 by 30 patches were randomly sampled from the images. The simulated cells parameters $a$ and $b$ are set relative to the standard deviation of $s$. Specifically $a=0.31\sigma(s)$ and $b=1.8sigma(s)$, using the same values as Sharpee et al.
The absence or presence of spike for a given patch is treated as a label. 40,000 patches and the corresponding labels were given to the metric learning algorithm. Mini-batch optimization was run and the results are displayed for a Mahalanobis metric (B) and a weighted metric (C). To our knowledge, this was the first attempt to use a weighted metric algorithm to infer the importance of individual pixels on a simulated simple cell.